5. Build a dashboard
A useful CRM dashboard answers four questions on one screen: how many leads landed, how fast they convert, where the pipeline is concentrated, and what is closing this quarter.
Estimated time: 25 minutes.
5.1 Layout
Create a new dashboard crm-overview with a 12-column grid:
| Row | Widget | Width |
|---|---|---|
| 1 | KPI: Leads this week | 3 |
| 1 | KPI: Conversion rate (qualified / total) | 3 |
| 1 | KPI: Open pipeline value | 3 |
| 1 | KPI: Closing this quarter | 3 |
| 2 | Bar chart: leads by source | 6 |
| 2 | Funnel: opportunities by stage | 6 |
| 3 | Line chart: weekly created vs qualified leads | 12 |
| 4 | Table: top 10 opportunities by amount | 12 |
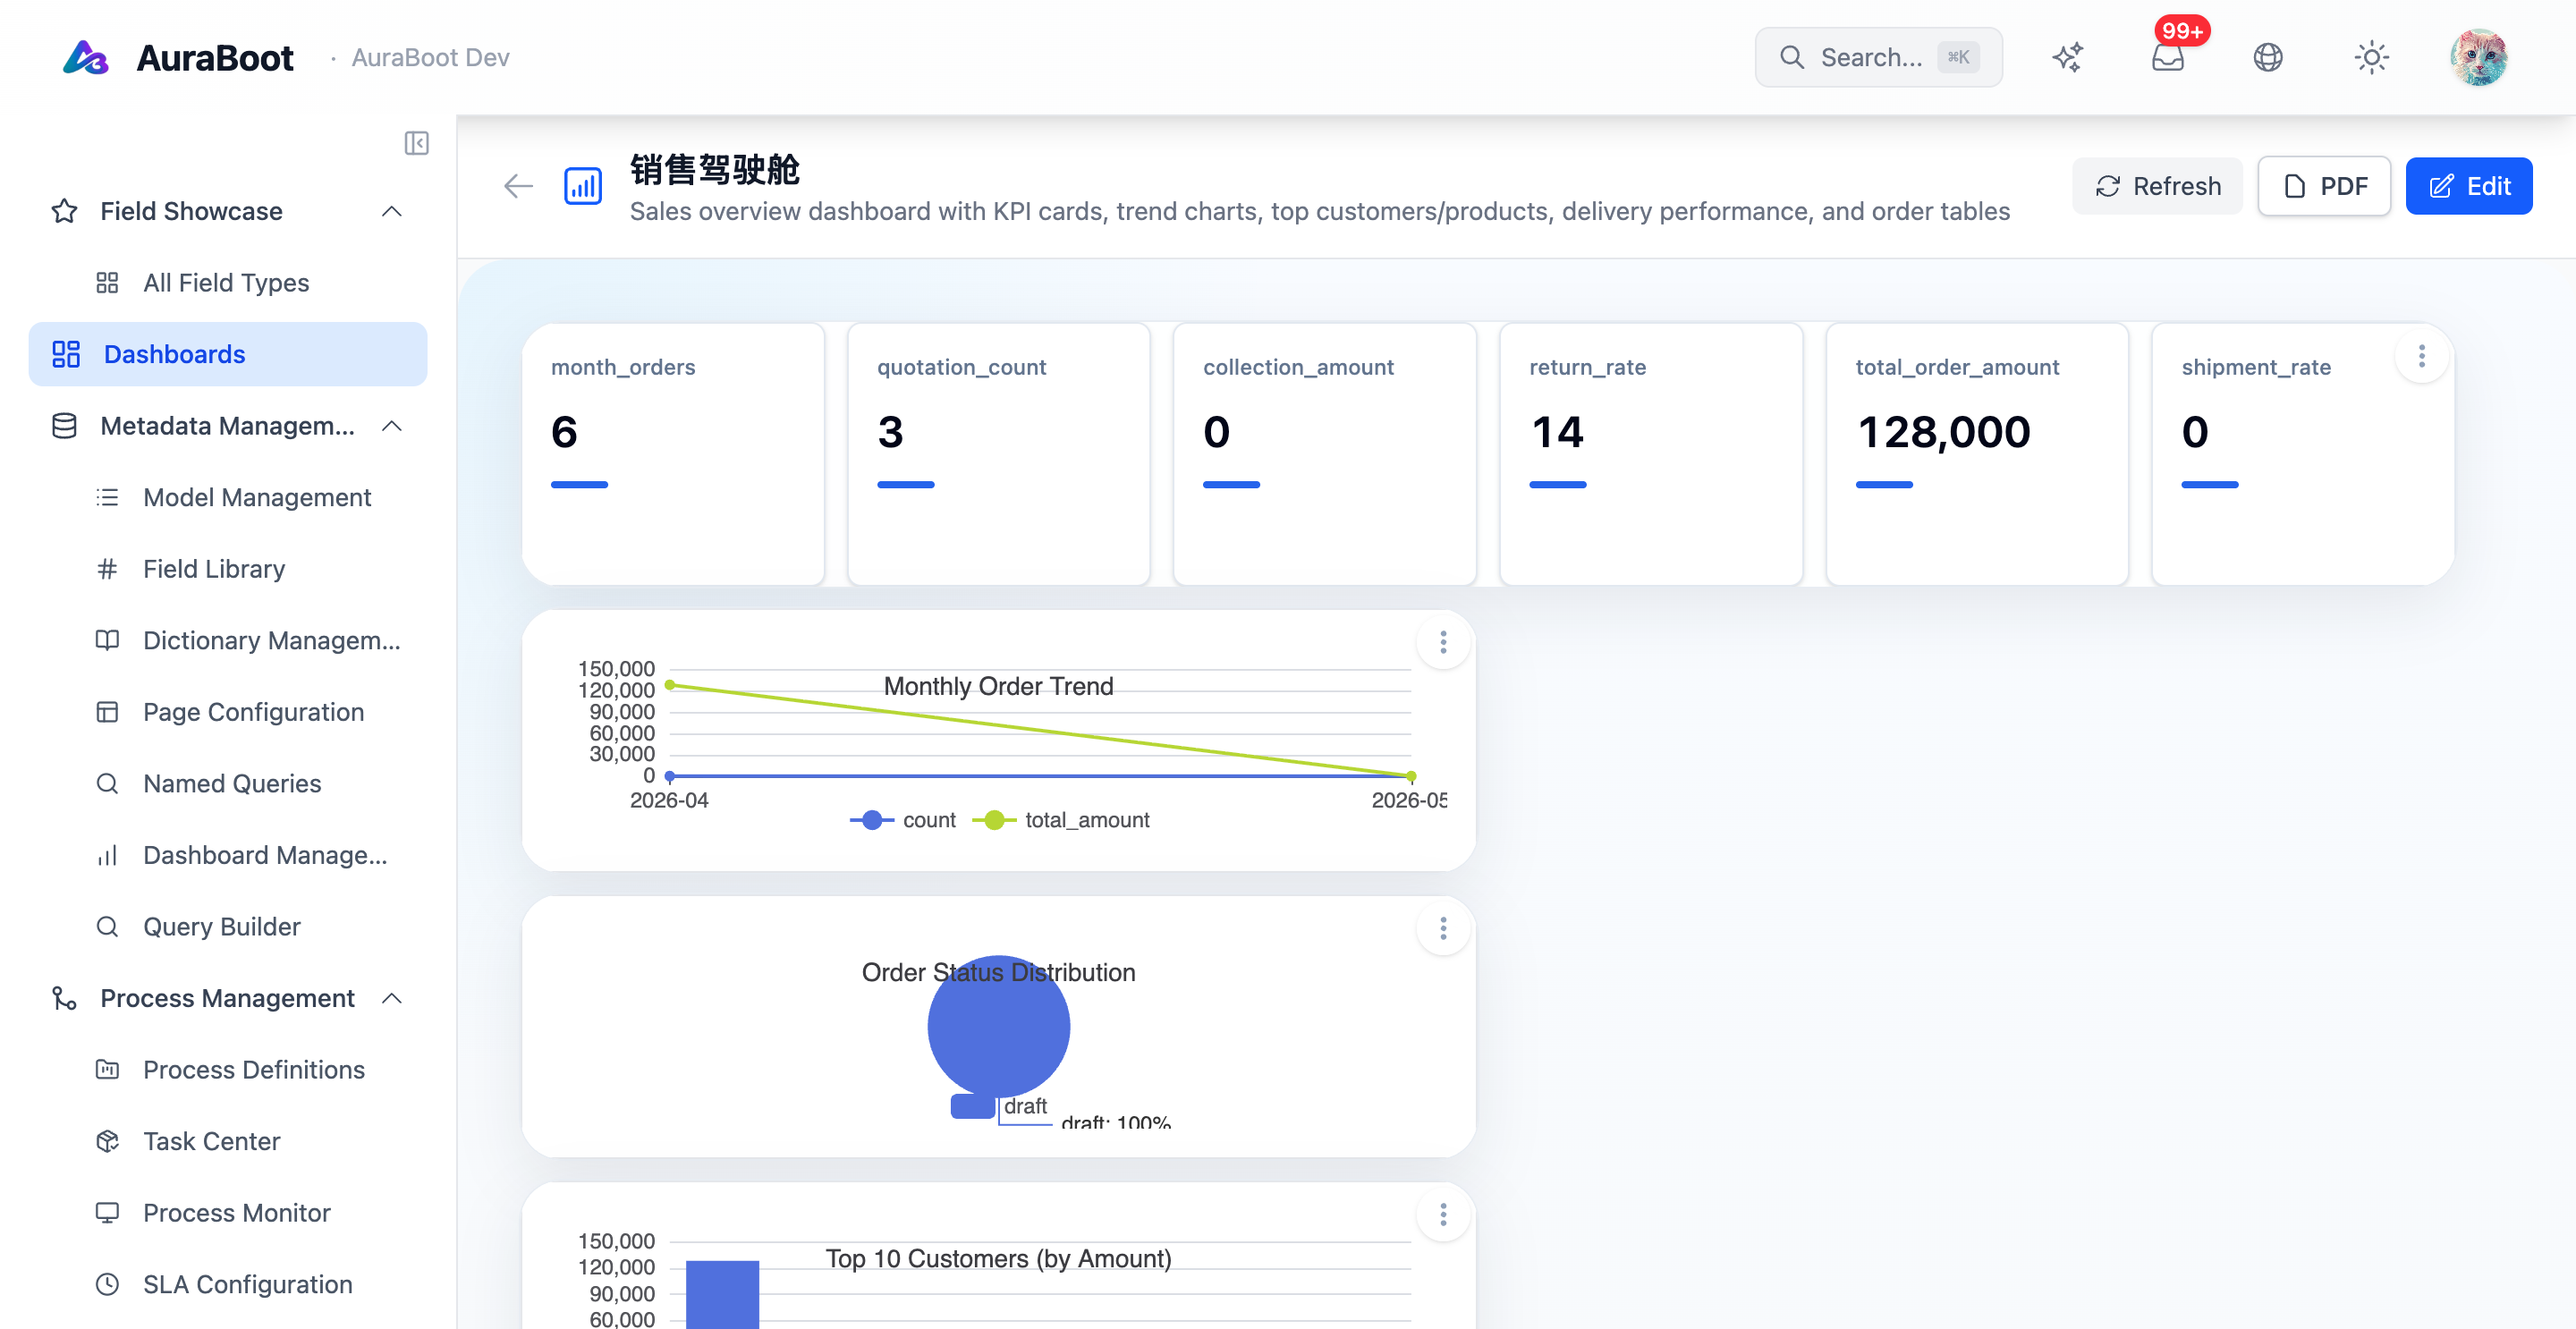
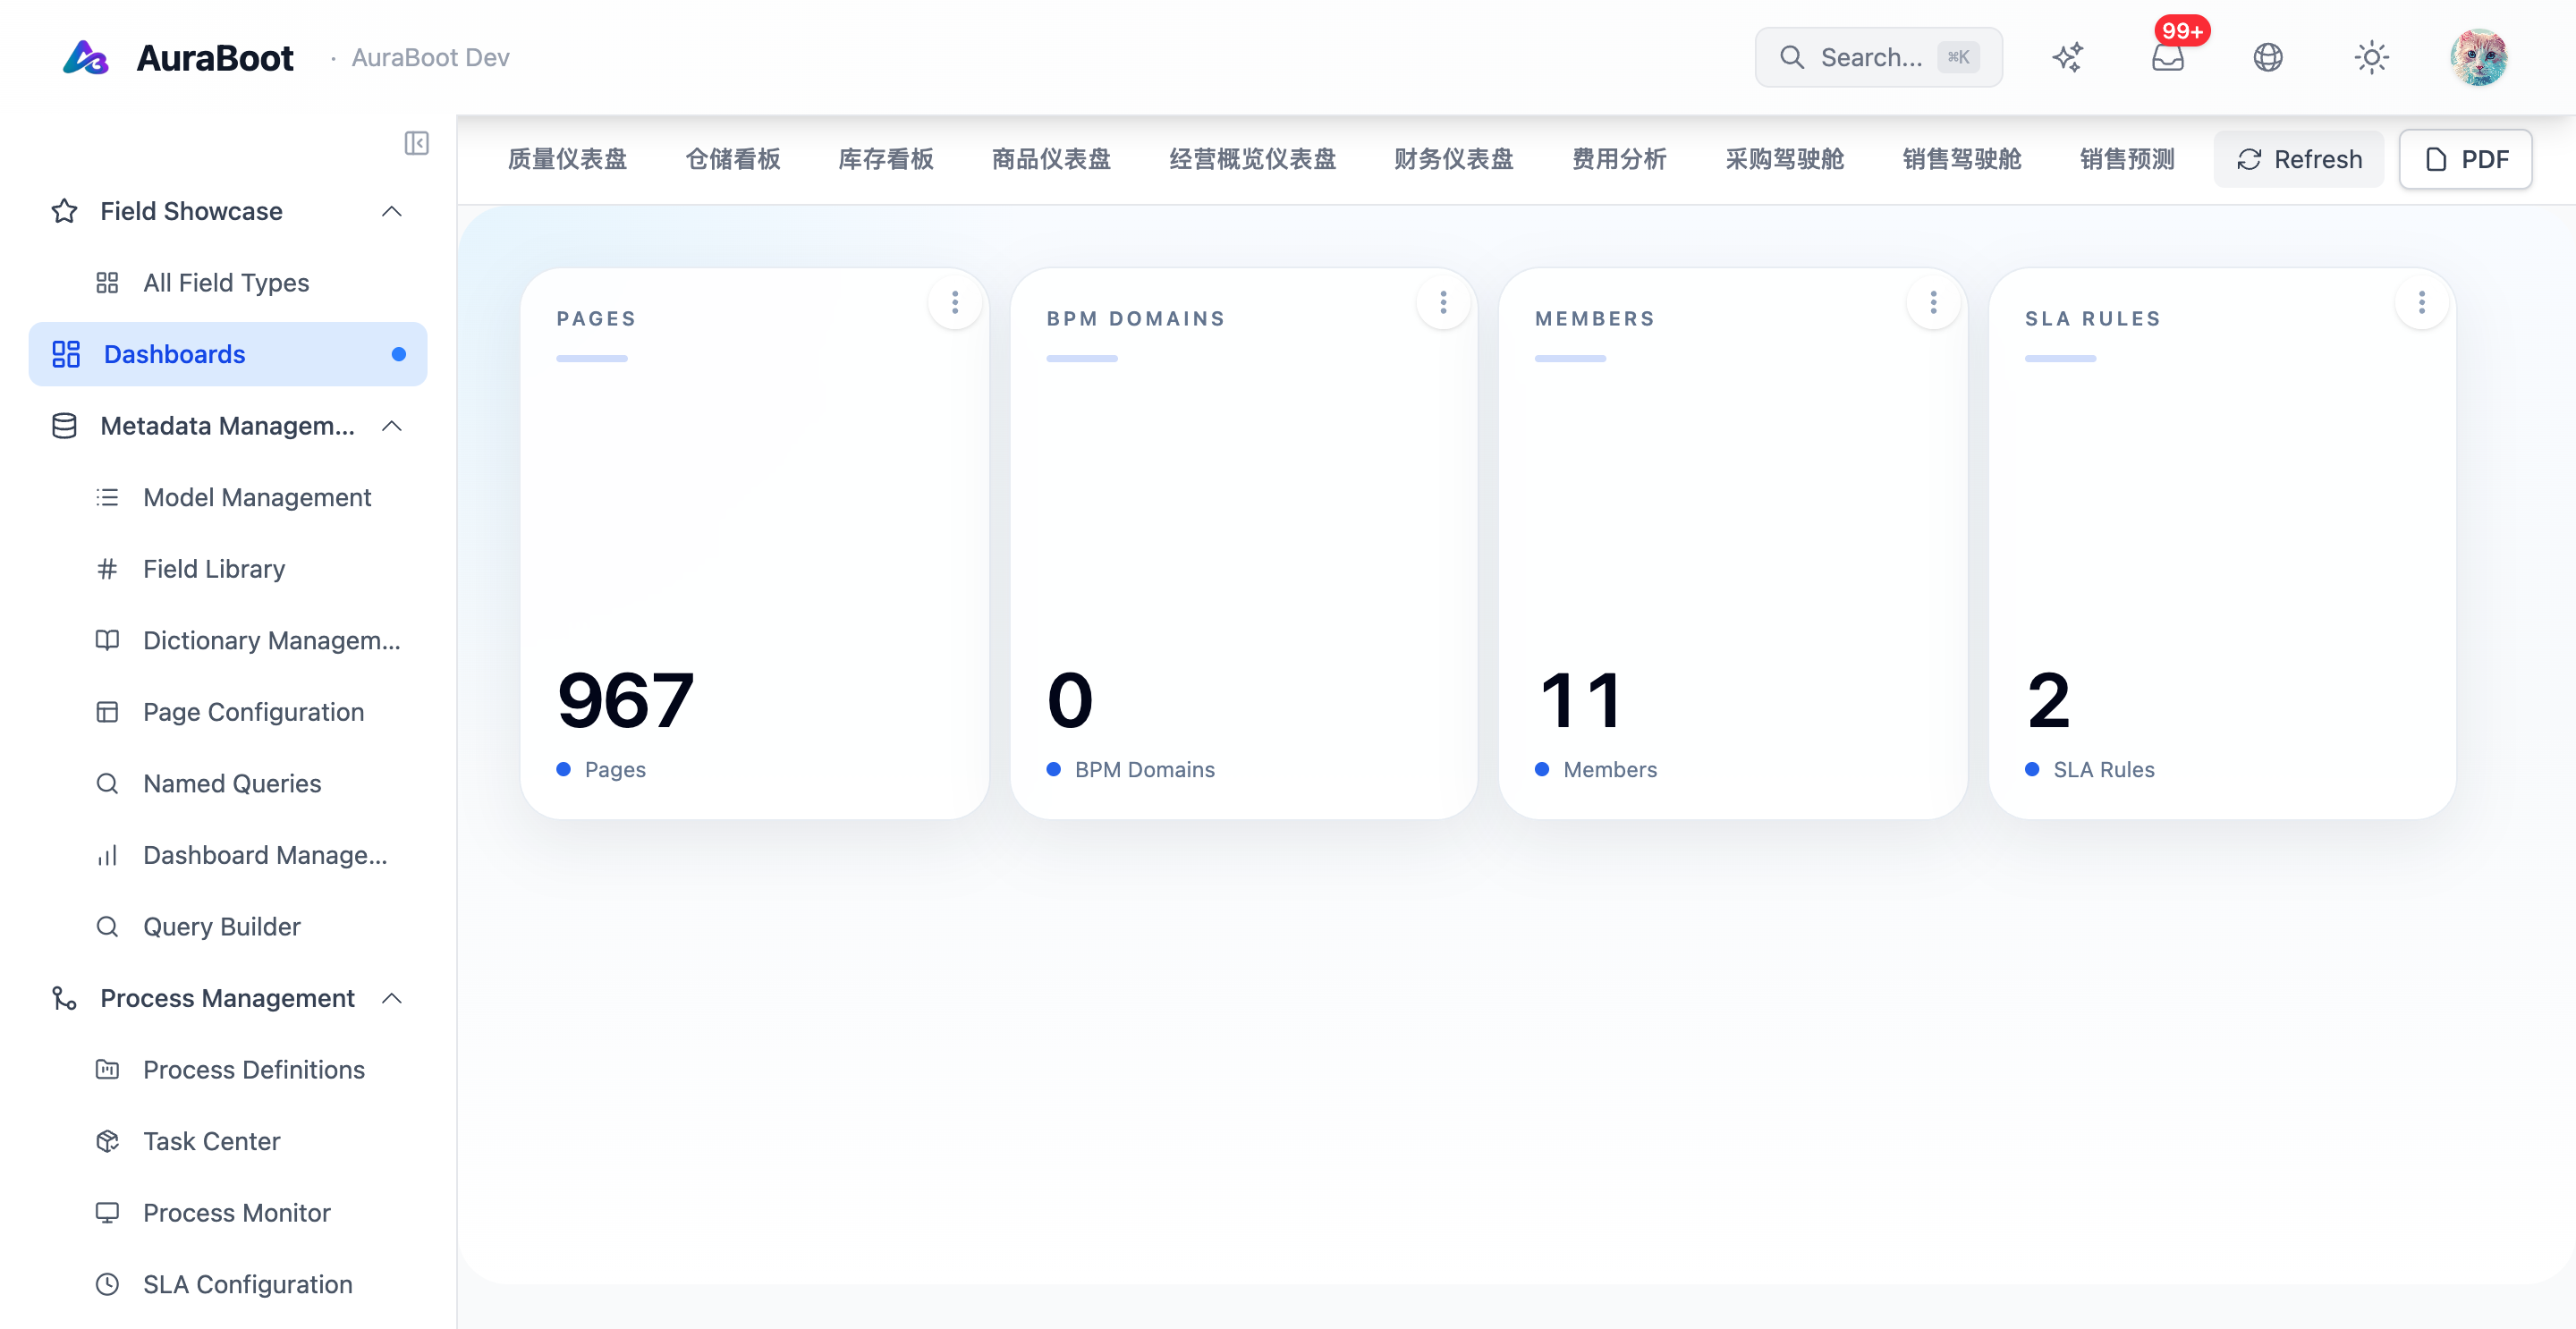
You start from the dashboards list page and click New dashboard to enter the editor — a grid canvas where each cell is a widget bound to a saved query.
5.2 Define the queries
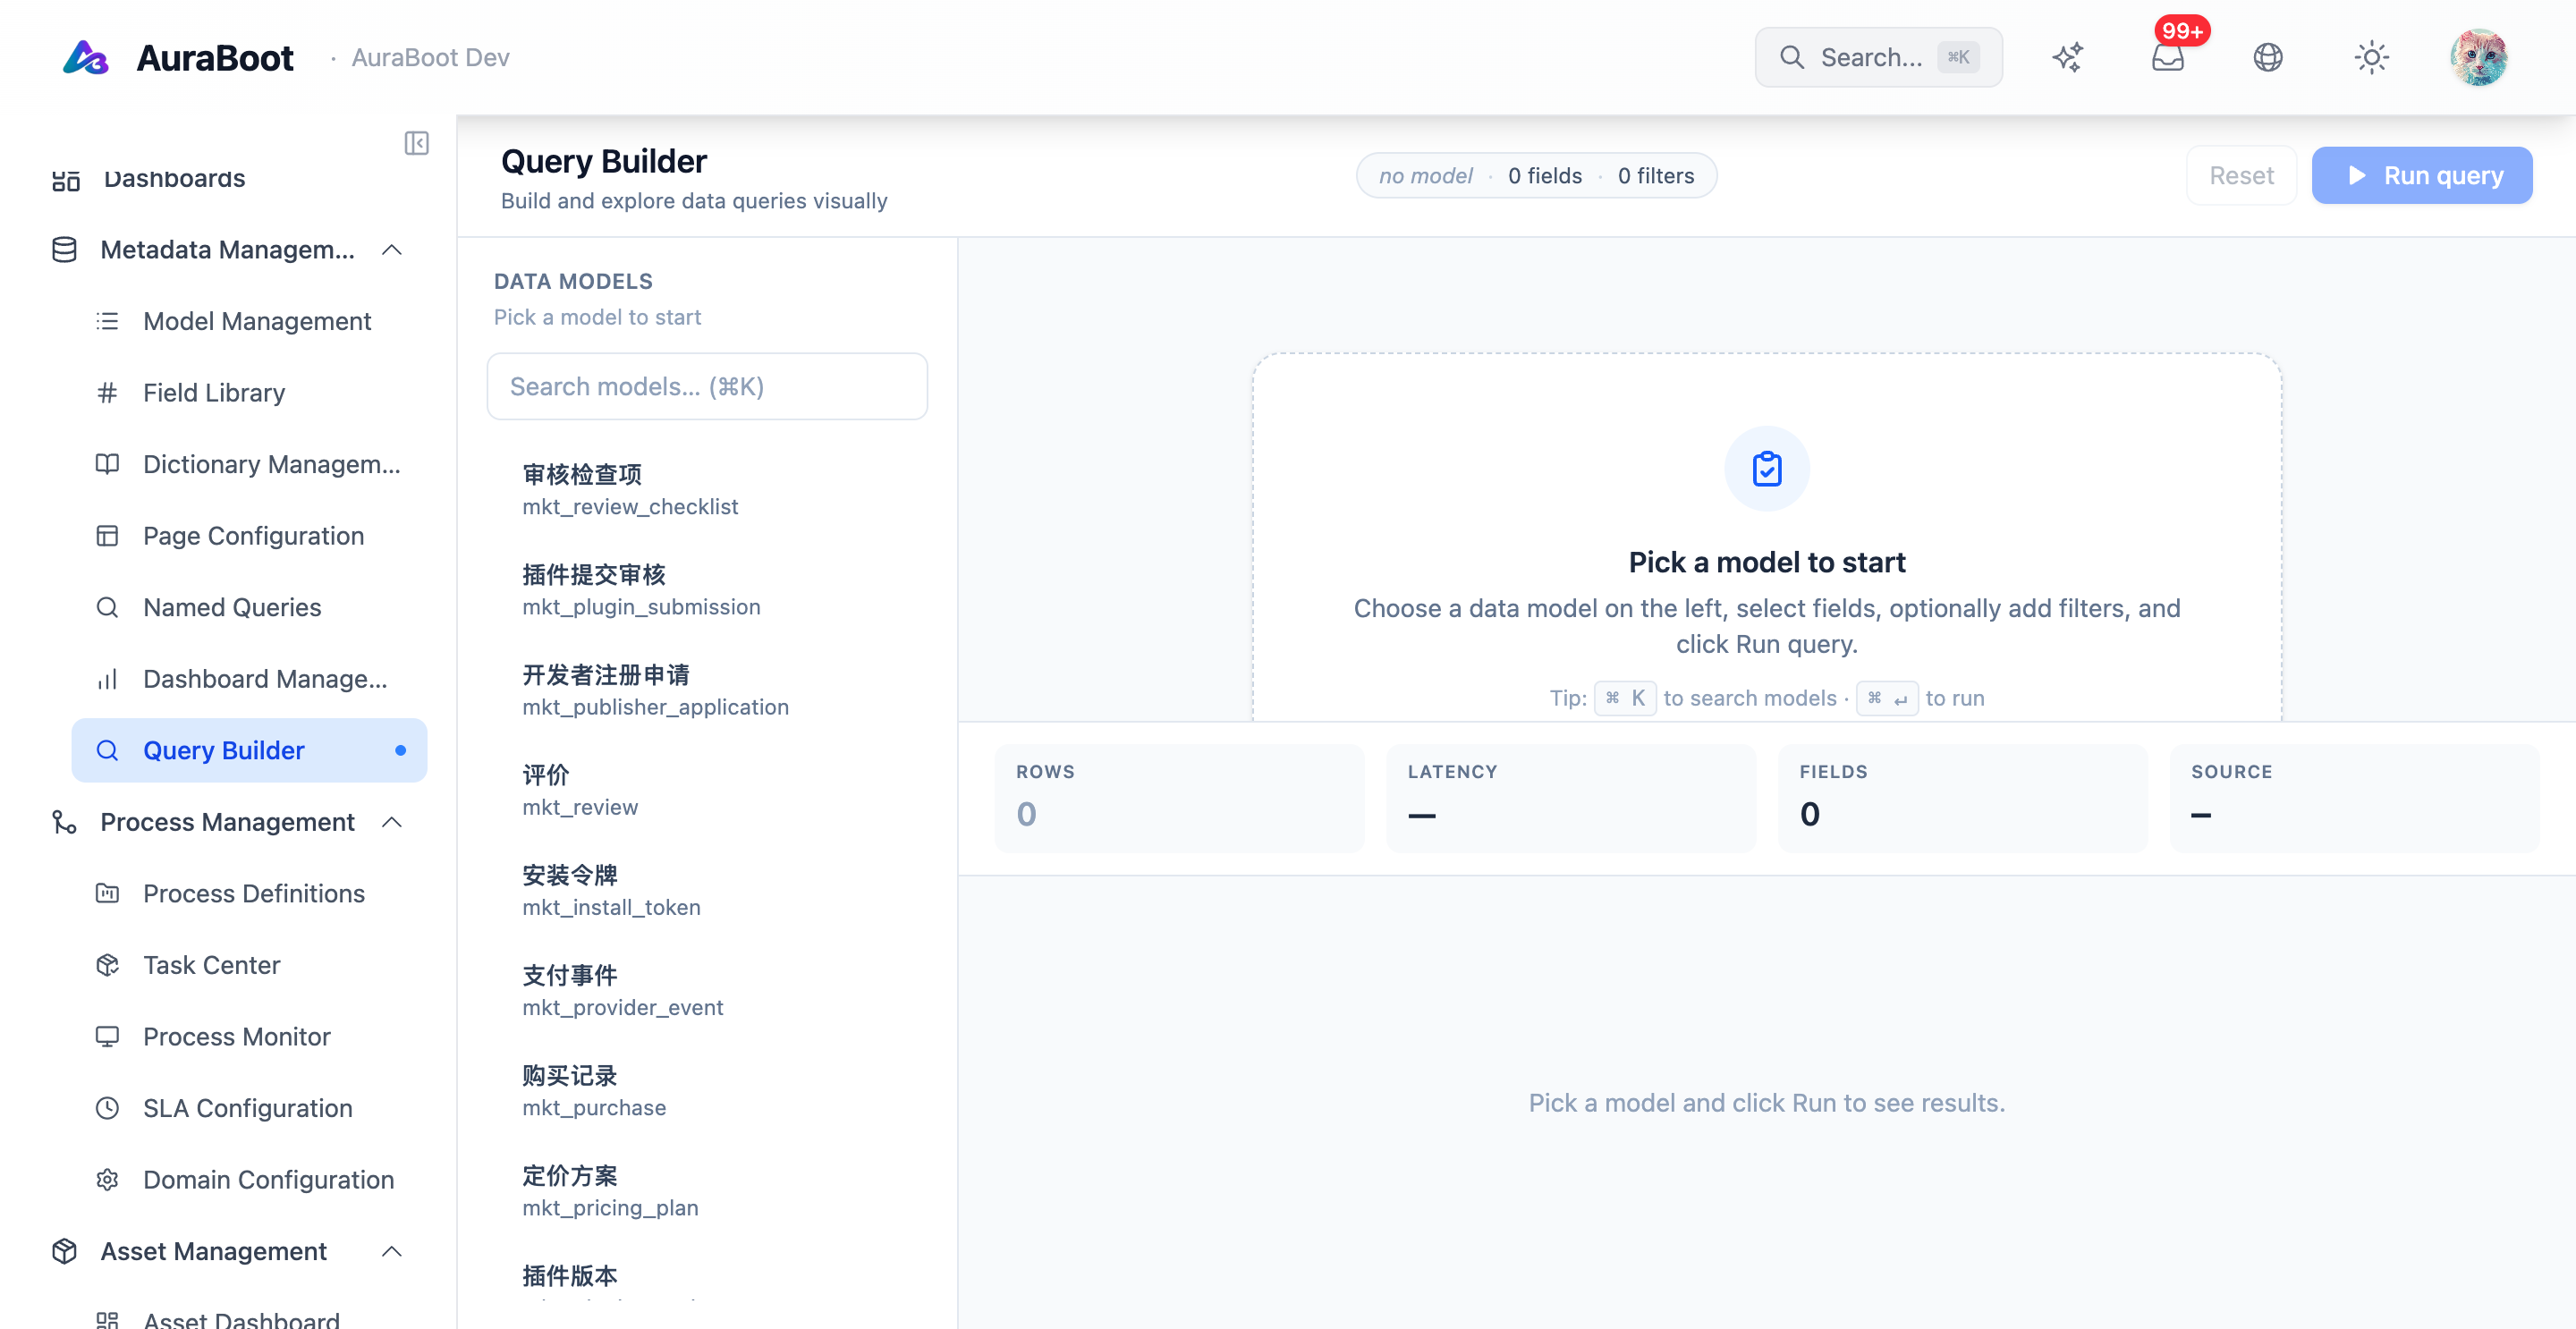
Use the Query Builder to define each widget's data source. The Query Builder is a visual SQL composer: pick a source model, add measures and dimensions, configure filters — then save the query as a reusable widget data source.
Example for the leads-by-source chart:
query:
  source: crm_lead
  groupBy: source
  measures:
    - { kind: count, alias: leads }
  filters:
    - field: created_at
      op: gte
      value: ${range.start}
    - field: created_at
      op: lte
value: ${range.end}${range.start} and ${range.end} come from the dashboard-level date range filter.
5.3 Drill-down
Configure the funnel widget so clicking a bar navigates to /docs/...?stage=<x> — i.e. opens the Opportunity list page filtered by stage. This is one option per widget:
"onClick": {
  "kind": "navigate",
  "to": "page:crm_opportunity_list",
  "params": { "stage": "${bar.key}" }
}5.4 Verify
- All KPIs match a manual SQL count
- Date-range filter recomputes every widget
- Clicking a funnel bar lands on the filtered list page
- The dashboard renders in < 1 second on local data (~10k rows)