Dashboard Designer
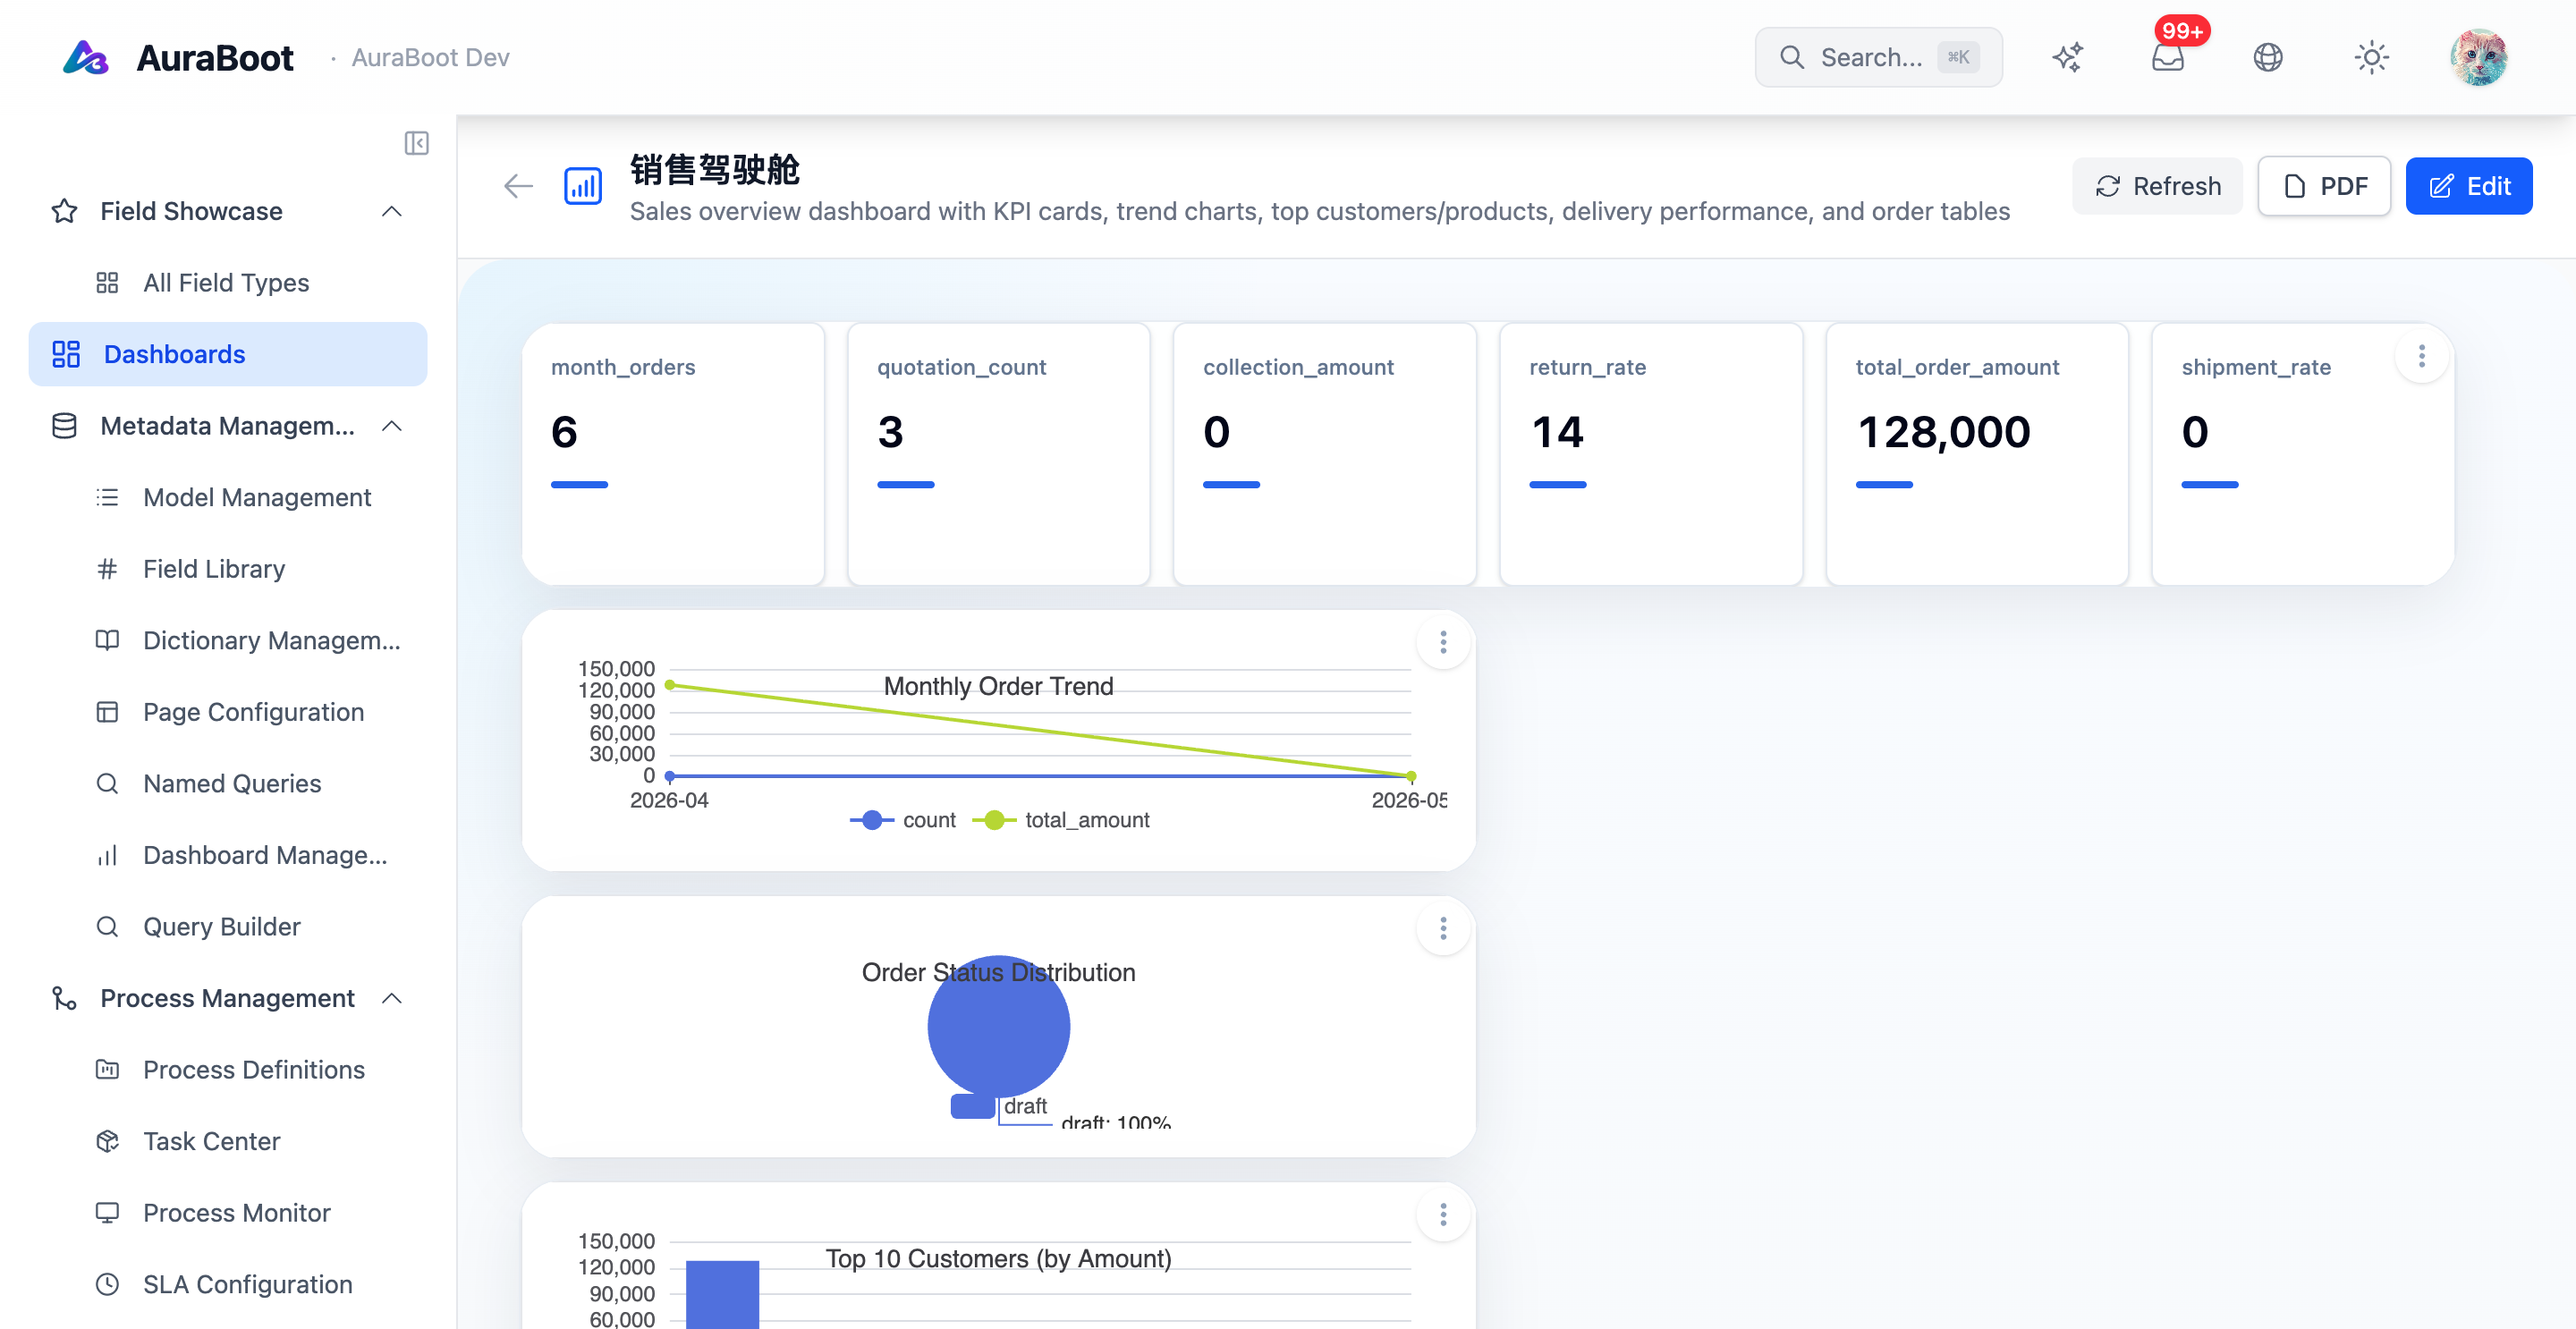
The Dashboard Designer builds operational dashboards from widgets and data sources. It is useful for KPIs, charts, leadership boards, team views, and embedded reporting pages.
When to Use It
Use the Dashboard Designer when the user needs to monitor data, compare trends, or jump from a metric into records.
Good examples:
- Sales pipeline by stage
- Open approvals by department
- SLA breach count by priority
- Revenue, margin, or order volume over time
- Work queue health by owner
Do not use it for transactional data entry. Use Page Designer for forms and record operations.
Workspace
The designer follows a three-panel structure:
| Area | Purpose |
|---|---|
| Widget palette | Add metric cards, charts, tables, text, images, and other widgets |
| Canvas | Arrange widgets on a responsive grid |
| Properties panel | Configure data source, style, linkage, drilldown, and refresh behavior |
Dashboards are designed in author mode and rendered through the dashboard viewer for end users.
Widget Categories
| Category | Examples | Use case |
|---|---|---|
| Metric | Number card, progress | Single KPI or target tracking |
| Chart | Bar, line, pie, area, funnel, radar | Comparison and trend analysis |
| Data | Table, leaderboard | Top records or ranked output |
| Content | Rich text, image, iframe, countdown | Context, embeds, and supporting content |
The exact widget set can vary by plugin installation. OSS provides the core dashboard designer and widget registry. Enterprise deployments may add advanced widgets through plugins.
Data Sources
Dashboard widgets should bind to structured sources rather than ad hoc frontend code.
| Source | Best for |
|---|---|
| Aggregate query | Count, sum, average, min, max by dimensions |
| Named query | Reusable SQL or backend-defined data contract |
| Static data | Rich text, demo content, or fixed display values |
For production dashboards, prefer named queries when the logic is shared by multiple widgets or needs backend review.
Layout
The dashboard canvas uses a grid layout. Authors can drag and resize widgets while the designer keeps placement metadata in the dashboard definition.
Common layout guidance:
- Put the most important KPI cards at the top
- Group related charts into rows
- Keep tables below summary metrics
- Use consistent time filters across widgets
- Avoid dashboards that require horizontal scrolling
Linkage and Drilldown
Dashboards become more useful when widgets respond to each other.
| Capability | Behavior |
|---|---|
| Linkage | Clicking one widget filters related widgets |
| Drilldown | Clicking a chart element opens a more detailed view |
| Refresh | Widgets reload on a configured interval |
Use linkage for operational analysis, such as selecting a region and filtering all revenue widgets to that region.
Publishing Checklist
- Every widget has a clear title
- Data sources return quickly with realistic filters
- Empty states are understandable
- Drilldown targets open valid pages
- Permissions match the data sensitivity
- Preview has been checked with non-admin permissions when needed
Next Steps